UNCHANGED NATIONAL RESULTS
Every system is perfectly designed to get the results it gets.
Paul Batalden, Dartmouth
THE POINT OF THE CHARTS BELOW:
FOR APPROXIMATELY 50 YEARS, RESULTS ARE STATIC.
Something HAS NOT CHANGED.
Something is CONTINUING to cause these very predictable, very consistent results.
SO CALLED "REFORMS" HAVE NOT CHANGED THE FORM OF SCHOOL DISTRICTS.
These "reforms" are used in school districts which continue attempting to solve the wrong problem: get students, who are all wonderfully different, to learn at the same pace.
Many of these initiatives and ideas are quite good.
We are GRATEFUL for them.
And yet, NONE of them have made a difference in RESULTS.
Some of these initiatives — all of the sudden — will start to work, within school districts addressing the RIGHT PROBLEM.
1983 (Book, report) A Nation at Risk: The Imperative for Educational Reform is the 1983 report of the United States National Commission on Excellence in Education.
1988 (Law) Reauthorization of the National Assessment of Educational Progress (NAEP), a.k.a. “The Nation’s Report Card.”
1989 (Organization) Teach For America
1990 (Technology) Personal Computers common in the home
1992 (Organization) Charter Schools
1994 (Law) Goals 2000 Act – Standards Based Education Reform
1994 (Organization) Kipp Charter Schools
2001 (Law) No Child Left Behind (NCLB)
2008 (Technology) Khan Academy
2008 (Book, report) Disrupting Class by Clayton M. Christensen, Michael Horn, and Curtis Johnson
2009 (Book, report) DRIVE: The Surprising Truth About What Motivates Us, by Daniel H. Pink.
2010 (Standards) Common Core Curriculum
2010 (Technology) IPad introduced
2015 (Law) Every Student Succeeds Act (ESSA)
2010+ (Standards) Standards Based Grading
IT IS A CREDIT TO SOCIETY THAT THE DATA IS AVAILABLE.
The Nations Report Card, part of the U.S. Department of Education, makes these charts possible.
It reflects VERY WELL on our society that we as a society have chosen to look unflinchingly.
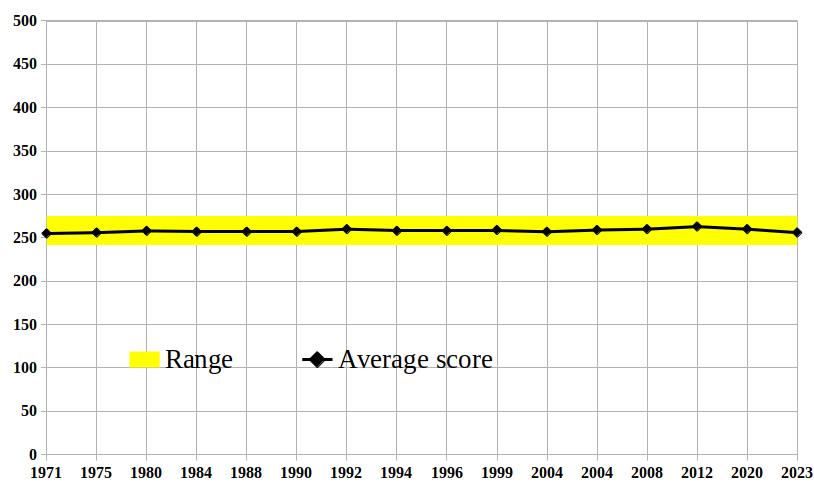
Math - 9 year olds
The Range: a narrow line showing over almost 50 years,
how little the Average score has changed.
Source: NAEP: Average Math Scores and Percentiles - 9 year old students
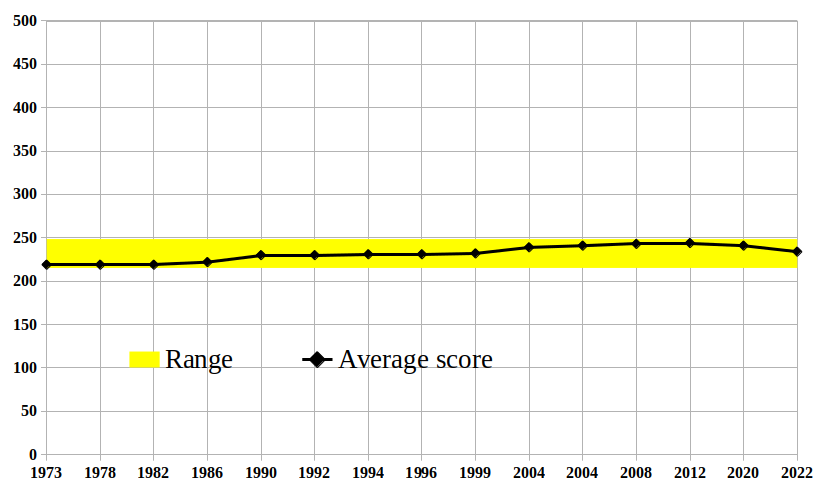
Math - 13 year olds
The Range: a narrow line showing that over 50 years,
how little the Average score has changed.
Source: NAEP: Average Math Scores and Percentiles - 13 year old students

Reading - 9 year olds
The Range: a narrow line showing that over 50 years,
how little the Average score has changed.
Source: NAEP: Average Reading Scores and Percentiles - 9 year old students

Reading - 13 year olds
The Range: a narrow line showing that over 50 years,
how little the Average score has changed.
Source: NAEP: Average Reading Scores and Percentiles - 13 year old students